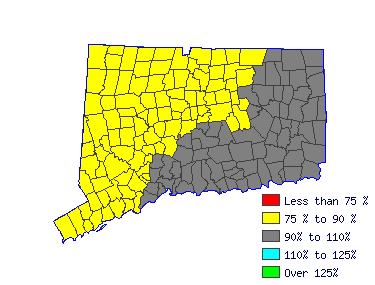
| Mean Wage History |
| Year | This Occupation | Compared to
Occupational Group | Difference |
| Current | $87166.84 | | $70028.74 |
| $17138.10 |
| 2014 | $86743.01 | +.5% | $69688.24 |
+.5% | $17054.77 |
| 2013 | $85118.35 | +1.9% | $68383.01 |
+1.9% | $16735.34 |
| 2012 | $83493.68 | +1.9% | $67077.77 |
+1.9% | $16415.91 |
| 2011 | $81869.02 | +2.0% | $65772.54 |
+2.0% | $16096.48 |
| 2010 | $80597.54 | +1.6% | $64751.05 |
+1.6% | $15846.49 |
| 2009 | $79184.79 | +1.8% | $63616.06 |
+1.8% | $15568.73 |
| 2008 | $78337.14 | +1.1% | $62935.07 |
+1.1% | $15402.07 |
| 2007 | $76006.09 | +3.1% | $61062.34 |
+3.1% | $14943.76 |
| 2006 | $73463.14 | +3.5% | $59019.36 |
+3.5% | $14443.78 |
| Year | This Occupation | Compared to
All Occupations | Difference |
| Current | $87166.84 | | $54046.93 |
| $33119.91 |
| 2014 | $86743.01 | +.5% | $53606.09 |
+.8% | $33136.92 |
| 2013 | $85118.35 | +1.9% | $52459.91 |
+2.2% | $32658.44 |
| 2012 | $83493.68 | +1.9% | $51401.89 |
+2.1% | $32091.79 |
| 2011 | $81869.02 | +2.0% | $50520.21 |
+1.7% | $31348.80 |
| 2010 | $80597.54 | +1.6% | $49726.70 |
+1.6% | $30870.84 |
| 2009 | $79184.79 | +1.8% | $48889.11 |
+1.7% | $30295.68 |
| 2008 | $78337.14 | +1.1% | $48227.85 |
+1.4% | $30109.29 |
| 2007 | $76006.09 | +3.1% | $46993.50 |
+2.6% | $29012.60 |
| 2006 | $73463.14 | +3.5% | $45494.64 |
+3.3% | $27968.50 |
|
Reference Date: 1st Quarter 2015 |
State of Connecticut Department of Labor Office of Research
200 Folly Brook Boulevard Wethersfield, CT 06109
Phone: 860-263-6285 |

| | | | |
| Top Areas For This Occupation |
|
|
|
 |


